Cisco IP SLA (Service-Level Agreement)
In this lesson we’re going to take a look at IP SLA (Service-Level Agreement) within Cisco devices and how it can be utilized.
Exam Topic
4.0 Network Assurance
4.5 Configure and verify IPSLA
Video Overview
Overview
IP SLA is a tool that’s built into Cisco IOS devices that allows us to monitor network performance and collect valuable information.
The IP SLA tool does this by sending self-created traffic to the device we want to monitor and then records the results.
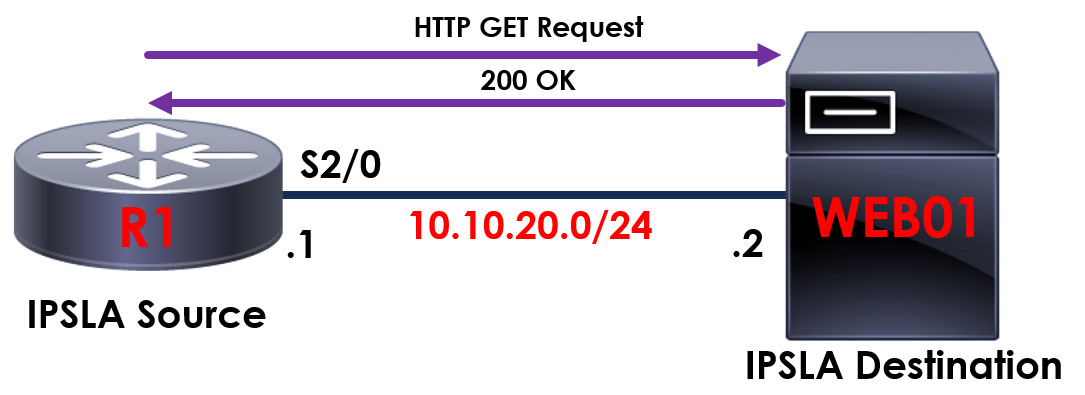
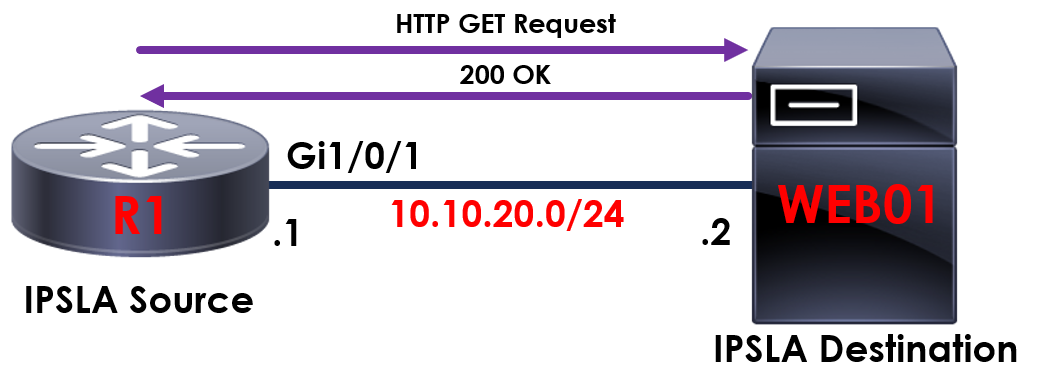
To provide some context on how this works, take a look at our example above.
In the example we’re taking advantage of IP SLA on R1 to send continual HTTP requests to WEB01. This then allows us to monitor and confirm that our web page hosted on WEB01 is online and loading correctly.
Already, you can see the benefits that IP SLA provides, however let’s take this a step further and start to take a look at the real power IP SLA provides.
One of the fantastic benefits of IP SLA is the ability to combine it with routing protocols.
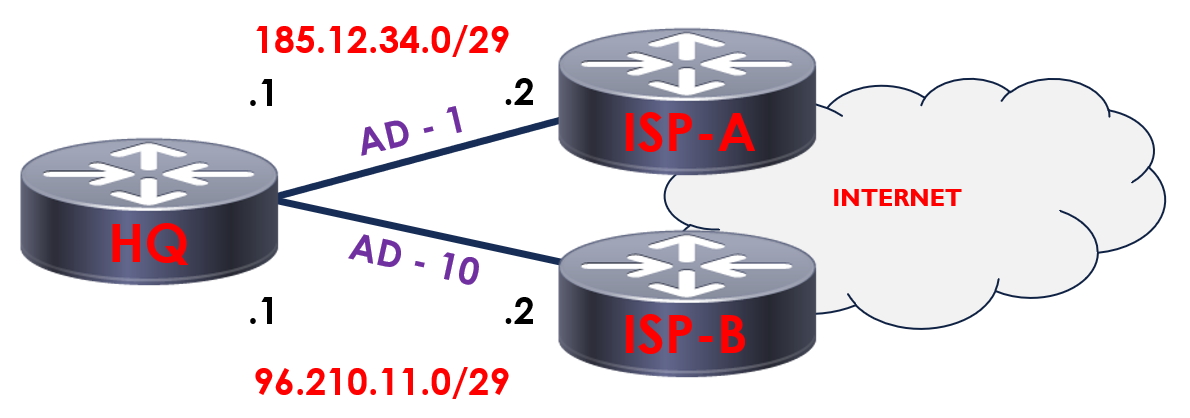
Here you can see SITE_A connected to two different internet providers – ISP1 and ISP2.
By default, all traffic destined for the internet routes via ISP1. In the event ISP1 is unavailable, traffic is then routed via ISP2.
This is achieved by amending the advertised distance (AD) of our routes. ISP1 has a lower AD (1) than ISP2 (10). Due to this, ISP1 is used as the primary route unless our interface to ISP1 is down, then traffic routes via ISP2.
This is great, however what happens if our interface connected to ISP1 doesn’t go down but our ISP is experiencing issues? Our route to ISP1 will remain in the routing table, therefore traffic will not automatically failover to ISP2.
With the power of IP SLA, we have the ability to resolve this by running a continual ping to ISP1 at the remote end of our point-to-point connection.
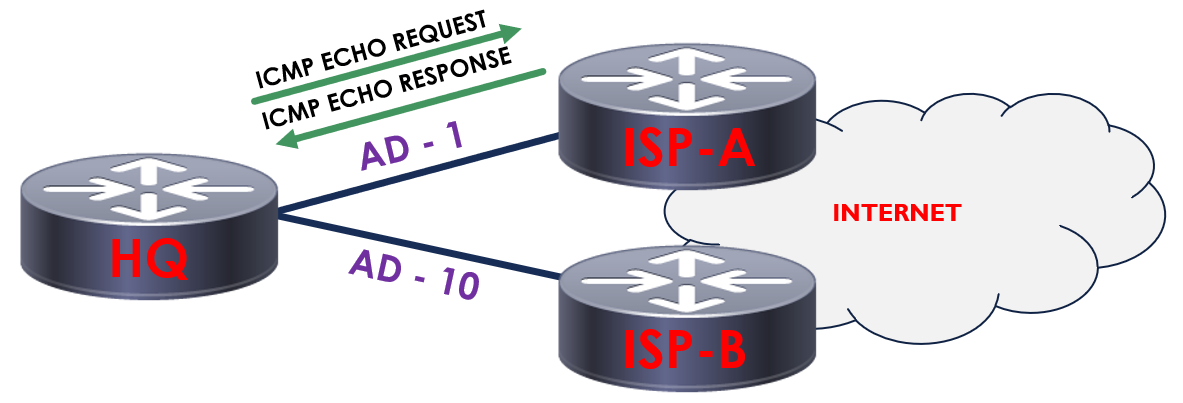
In our example, SITE_A is now using IP SLA to generate and send continual ping requests to ISP1. As long as we’re still getting a response from ISP1, we will continue to use this as our default route.
In the event that we no longer get a response from ISP1, we can then automatically switch over to ISP2 using a tracking object.
We have a number of probes that can be used to continuously monitor and collect vital network information.
These include:
Configuration
Now we understand the functionality of IP SLA, let’s take a look at how we can configure it on our Cisco IOS devices.
ICMP Echo Probe
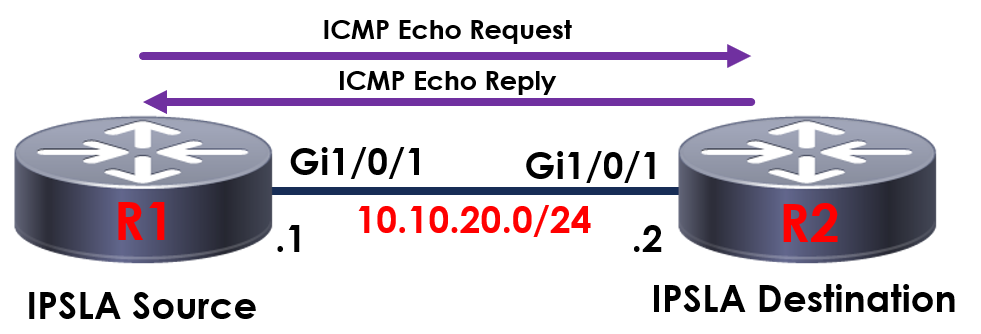
In the topology above, we’ll be sending an ICMP echo probe from R1 to S01 to confirm our device is online.
R1#configure terminal
R1(config)#ip sla 1
First off, we’ll create our IP SLA task.
We can have multiple IP SLA tasks running on our devices so we’ll assign this as 1.
R1(config-ip-sla)#icmp-echo 10.10.20.10 source-ip 20.10.20.1
R1(config-ip-sla)#frequency 60
R1(config-ip-sla)#exit
We’ll then use icmp-echo to first of all tell R1 which device we want to send the ICMP echo too.
We might have numerous interfaces on our device so we’ll specify the IP address we want to send our ICMP echo from with the source-ip.
Following this, we need to instruct R1 how often to send the ICMP echo to 10.10.20.10. This is done via the frequency command. The time specified is in seconds, so in this example we send an ICMP echo every 60 seconds.
Now our IP SLA has been configured, we need to schedule when we want to run it and for how long for in order to activate it.
R1(config)#ip sla schedule 1 life forever start-time now
We use the ip sla schedule command to complete this. First, we’ll specify our IP SLA process – 1. We have the option to schedule when our IP SLA runs, however in this example we’ll then start our IP SLA now to run forever.
We can confirm the configuration with the following command:
R1#show ip sla configuration 1
IP SLAs, Infrastructure Engine-II.
Entry number: 1
Owner:
Tag:
Type of operation to perform: echo
Target address: 10.10.20.10
Source address: 10.10.20.1
Request size (ARR data portion): 28
Operation timeout (milliseconds): 60000
Type Of Service parameters: 0x0
Verify data: No
Vrf Name:
Schedule:
Operation frequency (seconds): 60
Next Scheduled Start Time: Start Time already passed
Group Scheduled : FALSE
Randomly Scheduled : FALSE
Life (seconds): Forever
Entry Ageout (seconds): never
Recurring (Starting Everyday): FALSE
Status of entry (SNMP RowStatus): Active
Threshold (milliseconds): 5000
Distribution Statistics:
Number of statistic hours kept: 2
Number of statistic distribution buckets kept: 1
Statistic distribution interval (milliseconds): 20
History Statistics:
Number of history Lives kept: 0
Number of history Buckets kept: 15
History Filter Type: None
Enhanced History:
We can confirm then confirm our IP SLA is running and operating correctly using the following command:
R1#show ip sla statistics 1
Round Trip Time (RTT) for Index 1
Type of operation: icmp-echo
Latest RTT: 1 ms
Latest operation start time: .19:14:37.450 UTC Mon May 25 2020
Latest operation return code: OK
Number of successes: 51
Number of failures: 0
Operation time to live: Forever
HTTP GET Probe
Using our example from before, this time we’ll be using a HTTP GET probe to confirm the status of our internal webpage. Using R1 we want to confirm that our webpage hosted on WEB01 is loading and online.
R1#configure terminal
R1(config)#ip sla 10
R1(config-ip-sla)#http get http://10.10.20.2
R1(config-ip-sla-http)#frequency 60
R1(config-ip-sla-http)#exit
As you can see, this time our command has changed slightly. We use the http get command to inform R1 which page we want to send HTTP GET probes too – in this case it’s 192.168.1.x. Again, we’ll send these probes every 60 seconds using the frequency command.
R1#show ip sla configuration 10
IP SLAs, Infrastructure Engine-II.
Entry number: 10
Owner:
Tag:
Type of operation to perform: http
Target address/Source address: 10.10.20.2/0.0.0.0
Target port/Source port: 80/0
Operation timeout (milliseconds): 60000
Type Of Service parameters: 0x0
HTTP Operation: get
HTTP Server Version: 1.0
URL: http://10.10.20.2
Proxy:
Raw String(s):
Cache Control: enable
Schedule:
Operation frequency (seconds): 60
Next Scheduled Start Time: Start Time already passed
Group Scheduled : FALSE
Randomly Scheduled : FALSE
Life (seconds): Forever
Entry Ageout (seconds): never
Recurring (Starting Everyday): FALSE
Status of entry (SNMP RowStatus): Active
Threshold (milliseconds): 5000
Distribution Statistics:
Number of statistic hours kept: 2
Number of statistic distribution buckets kept: 1
Statistic distribution interval (milliseconds): 20
History Statistics:
Number of history Lives kept: 0
Number of history Buckets kept: 15
History Filter Type: None
R1#show ip sla statistics 10
Round Trip Time (RTT) for Index 10
Type of operation: http:
Latest RTT: 6 ms
Latest operation start time: .21:38:15.563 UTC Mon May 25 2020
Latest operation return code: OK
Latest DNS RTT: 0 ms
Latest TCP Connection RTT: 3 ms
Latest HTTP Transaction RTT: 3 ms
Number of successes: 3
Number of failures: 0
Operation time to live: Forever