Performing Layer 1 Site Surveys
Following on from our overview lesson of site surveys, in this lesson we’re going to be taking a look at layer 1 site surveys. We’ll understand the benefits they provide, how to perform them and to interpret the data.
Exam Topic
1.0 Wireless Site Survey
1.3 Perform and analyze a Layer 1 site survey
Overview
A layer 1 site survey is one of the surveys overlooked when designing wireless networks. The survey involves scanning the physical RF environment (layer 1 on the OSI model) for potential RF interference.
Performing the survey is incredibly useful in order to locate and rectify any potential interference before proceeding with your design.
In order to perform a layer 1 site survey, specialist tools are required. Specifically, to perform a layer 1 survey, a Spectrum Analyzer is required.
The spectrum analyzer tool will capture the raw RF data and analyze the energy that’s detected. This is analyzer itself consists of specialist hardware to capture the data.
Some of the leading hardware tools includes;
You might have looked at the list seeing Cisco AP and scratched your head? The great thing about certain models of Cisco APs is that they include a feature called CleanAir. What this allow us to do is use the AP to act as
a spectrum anaylzer and capture the raw RF data.
Although it’s possible, it does require the AP to be associated to a switch and WLC, thus not making it the best tool for all scenarios.
Performing a Layer 1 Survey
Now that we’ve got a better understanding of layer 1 site surveys, let’s take a look at how they’re performed. In our example we’ll be using Ekahau Pro and their spectrum analyzer tool; Ekahau Sidekick.
To provide an overview, I will be using the Spectrum-Onsite-Example project provided by Ekahau. I won’t be covering a step-by-step process of using Ekahau in this lesson. We’ll cover this in a separate lesson as it can get in-depth.
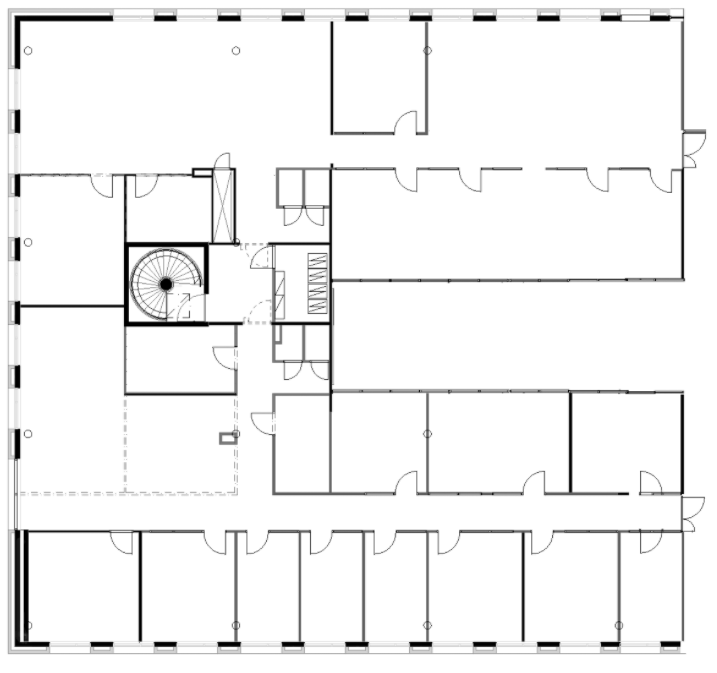
Using the Ekahau tool, we first import our map of the location we’re surveying. As mentioned before, I’ll be using an example provided by Ekahau.
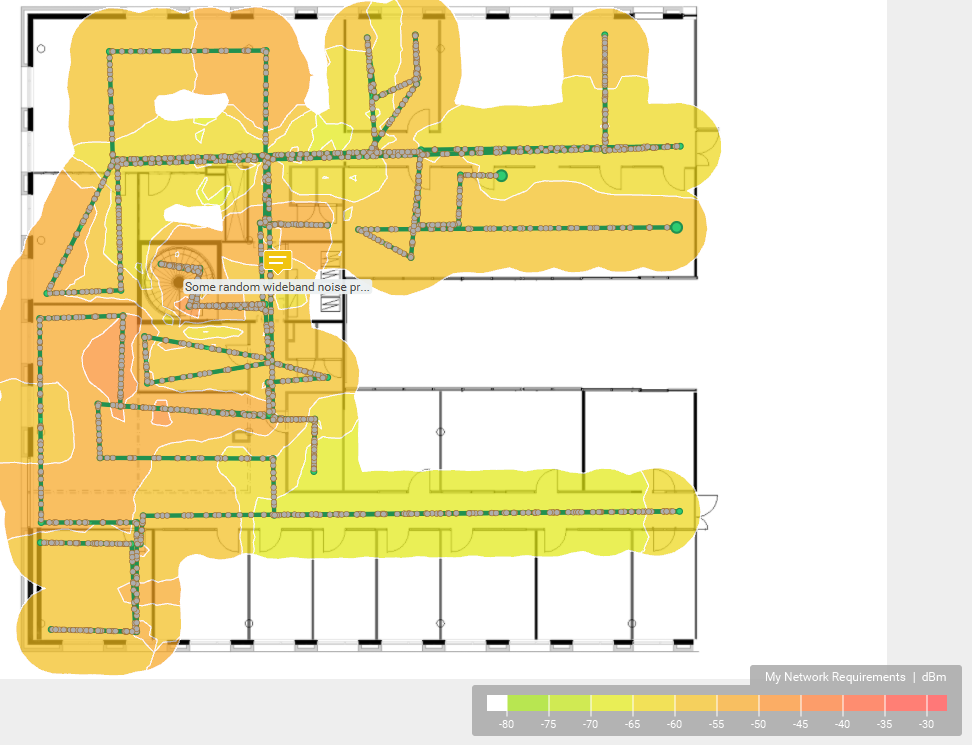
We then perform a walkthrough survey using Ekahau and our spectrum analyser; Ekahau Sidekick.
The green line and dots on our drawing above indicate where we’ve walked and scanned the RF environment. It then provides us an overview of the RF spectrum using the key at the bottom right.
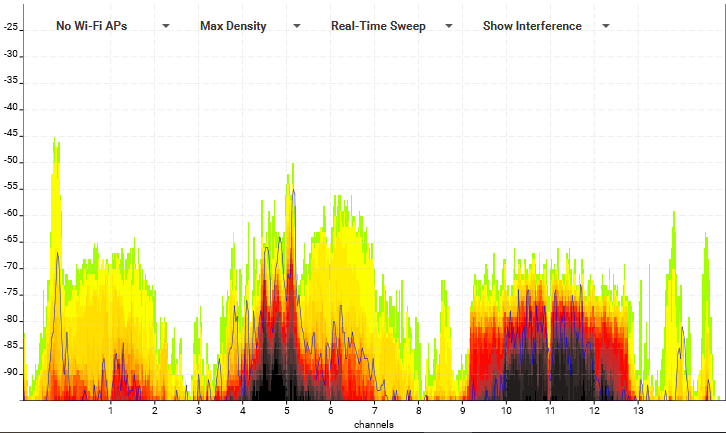
Alternatively, we can either view which channels have RF interference in a rainfall view. In the example above, we can see that channels 4 – 6 on 2.4GHz have high interference.
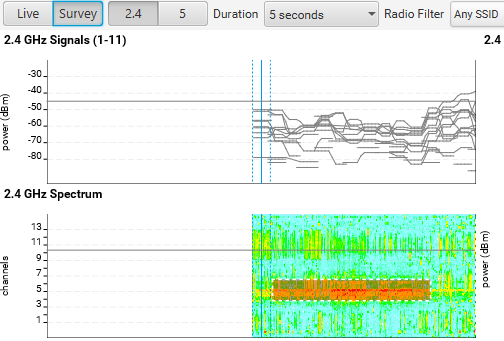
We also have the ability to view the RF spectrum channel by channel. In the example above we can see that we’ve got medium to high interference across channels 1, 6 and 11.